

Abstract
Beyond key ecological services, marine resources are crucial for human food security and socio-economical sustainability. Among them, shellfish aquaculture and fishing are of primary importance but become more vulnerable under anthropogenic pressure, as evidenced by reported mass mortality events linked to global changes such as ocean warming and acidification, chemical contamination, and diseases. Understanding climate-related risks is a vital objective for conservation strategies, ecosystems management and human health. We provide here a comprehensive study of the historical mortality of adult oysters related to observed climate variability along the French Atlantic coast from 1986 to 2015, and we built on this knowledge to develop hindcast and forecast assessments of the oyster mortality risk from 1900 to 2100. We show that mortality events usually occur several months after winters dominated by the occurrence of positive North Atlantic oscillation (NAO+) atmospheric regimes of circulation. We explain the lagged response by the multiseasonal long-lasting imprint of wintertime NAO+ on biological and environmental factors, which partly structure oyster mortality etiology. Very high wintertime seawater temperature anomalies at the interannual timescale, which were mostly attributable to internal climate variability through NAO+ and which led to pronounced mortality over the observed period, are then treated as 'analogs' in a large ensemble of Intergovernmental Panel on Climate Change emission scenarios and models in order to anticipate future risks. Without any adaptive process, we provide evidence that actual exceptional mortality is likely to become the norm by ∼2035, even if global warming is limited to +2 °C relative to pre-industrial levels.
Export citation and abstract BibTeX RIS

Original content from this work may be used under the terms of the Creative Commons Attribution 3.0 licence. Any further distribution of this work must maintain attribution to the author(s) and the title of the work, journal citation and DOI.
Introduction
Among marine life, invertebrates and especially filter feeders like oysters are key species in coastal ecosystems due to the various ecological services they provide (building reef habitats, trophic resource and benthic-pelagic coupling), and due to their economic and societal value through fishing and aquaculture. The Pacific oyster, Crassostrea gigas, which is currently widespread worldwide (Miossec et al 2009), is the main farmed species of oyster with 3.5 106 tons globally produced in 2014 (Alfaro et al 2018). In Europe, C. gigas was introduced along the Atlantic coast in the late 1960s for shellfish aquaculture purposes (Humphreys et al 2014). In France, since the 1990s, its population has been the focus of a long-term biological monitoring network, which was initiated after the occurrence of significant summer mortality events in the late 1980s (Samain and McCombie 2008). Now, with more than 20 years of data acquired using a standard protocol, this monitoring network offers a valuable dataset to study the processes underpinning shellfish mortality, and more specifically to assess the role of climate variability beyond density-dependent processes (e.g. trophic competition). As marine sessile organisms, oysters in a given location are very sensitive to climate changes due to their inability to exit unfavorable conditions in the timescale of their lifespan: they may be viewed as climate sentinels of coastal ecosystems.
Oyster mortality etiology is known to be a multifactorial phenomenon associated with biotic (e.g. pathogen, food) and/or abiotic variables (e.g. oxygen, temperature, salinity). However, it is complex, even illusory, to observe all these environmental parameters over a long enough period to build robust statistics and compelling biophysical understanding; it would require considerable effort at the local scale (Pernet et al 2018). Interestingly, a significant part of the variance of most of the abiotic parameters is driven by larger-scale spatiotemporal climate forcings to which coastal ecosystems dynamics may be more sensitive in the seasonal-to-interannual timescale. In the present paper, we evaluate this hypothesis and provide evidence for the relevance of using climate metrics accounting for (i) spatiotemporal integration of high-frequency weather events and (ii) systemic versus individual variables, as an utmost opportunity to provide a comprehensive and reliable climate-related risk assessment for past, present and future oyster mortality in northern Europe.
Along the European coasts, traveling synoptic pressure systems, or storms, account for much of the atmospheric variability from meteorological to climate timescales, referring in the latter case to the interannual-to-decadal fluctuation of their preferred path. Storms are embedded in larger scale circulation patterns, or modes of variability, that encompass the entire North Atlantic basin. Several ways exist to characterize the midlatitude atmospheric circulation in the North Atlantic. The North Atlantic oscillation (NAO) index, defined as the sea-level pressure difference between the Azores and Iceland weather stations, is the simplest one. The NAO has been shown to be a key driver of ecological variations, through direct, indirect or integrated effects at individual and population levels, in terms of recruitment, abundance, growth rate, distribution, phenology, species assemblages and survival (Hallett et al 2004, Drinkwater et al 2010). Linear methods applied on pressure maps (e.g. principal component analysis) are also traditionally used to extract the modes of variability (Hurrell and Deser 2010). In this study, results from clustering analysis used to determine so-called weather regimes (e.g. see Barry and Carleton 2001 for a complete review) are preferred.
The focus is concentrated on the winter atmospheric season and associated lagged bioclimatic factors in order to interpret the subsequent annual mortality rate observed along the French Atlantic coast. Winter is known as a key period for coastal ecosystems especially regarding infectious diseases (e.g. cold winter barrier for pathogens, biological recovery for species) (Harvell et al 2002), and the load of nutrients sustaining spring blooms, etc. From a stand-alone climate perspective, winter dynamics controls most of the annual-mean climate variability of the midlatitude atmosphere and associated surface forcings, especially in the North Atlantic Ocean (Barrier et al 2013). Weather regimes are statistically better defined in wintertime compared to other seasons (Cassou et al 2011) and more importantly, lead to enhanced and persistent impacts over the ocean because of the seasonally much-deeper oceanic mixed layer depth that is limited to only a few meters in summer. Using preceding winter weather regimes to estimate forthcoming annual mortality is also interesting from a seasonal forecast and practical perspective. For future mortality assessments, we use observed relationships between winter weather regimes and bioclimatic factors as a base for knowledge to anticipate the near-term and long-term risks of mortality estimated from two contrasting climate change emission scenarios from the Intergovernmental Panel on Climate Change (IPCC): the 'business-as-usual' scenario (Representative Concentration Pathway, RCP8.5), which assumes that greenhouse gases (GHG) emissions continue to rise throughout the remainder of the 21st century, and the most stringent mitigation scenario (RCP2.6), which served as support for the Paris Agreement.
Data and methods
The weather regime paradigm: description and properties
The weather regime paradigm has been extensively used in the literature for meteorological and climate purposes to describe the midlatitude atmospheric variability. The regimes correspond to the preferred and/or recurrent quasi-stationary patterns of the atmospheric circulation over a large-scale (typically oceanic basin-wide) domain. They are spatially well defined, limited in number and have a typical nominal persistence of 6–10 days. Within this framework, the day-to-day meteorological fluctuations can be described in terms of temporal transition between regimes. The year-to-year (or longer timescale) climate fluctuations can be interpreted as changes in their frequency of occurrence provided the hypothesis of long-term quasi-stationary climate. Associated surface winds and air temperature anomalies, displaced cyclone activity within a given regime, result in recurrent anomalous fluxes at the ocean surface that can imprint long-lasting anomalies down to the bottom of the ocean mixed layer.
Statistically or technically speaking, weather regimes are classes of atmospheric circulation patterns gathered together from a similarity criterion. Those classes are defined by their mean conditions, or centroids, by their variance and by their frequency of occurrence. They are traditionally obtained from clustering techniques. Here we use the k-means algorithm that iteratively finds the optimal partition that minimizes the ratio of the variance within clusters to the variance between clusters centroids. The similarity criterion for clustering is the Euclidian distance. Daily winter maps of sea-level pressure (SLP) from the National Centers for Environmental Prediction-National Center for Atmospheric Research (NCEP-NCAR) reanalysis (Kalnay et al 1996) are classified in this study over the period 1958–2014, from 1 December to 31 March. The geographical domain is limited to the North Atlantic–Europe (NAE, 90°W-30°E/20°N-80°N) domain and a cosine weight as a function of latitude is applied to the data. The NOAA-20CR reanalysis product is used for earlier dates from 1900–1958.
Four regimes are commonly extracted over the NAE region in winter (supplementary figure S1 is available online at stacks.iop.org/ERL/13/104009/mmedia) according to standard reproducibility and classificability tests performed to objectively define k (Michelangeli et al 1995) and to assess the robustness and the consistency of the partition between observational datasets and selected periods (see e.g. Ouzeau et al 2011 comparing several atmospheric reanalyses). The two first SLP regimes (supplementary figures S1(a), (b)) can be viewed as the positive and negative phase of the North Atlantic oscillation (NAO+ and NAO- respectively), which can be essentially considered as a measure of the variability of the prevailing westerly flow over the North Atlantic. Note that spatial asymmetries between the two NAO phases are clearly shown here by clustering techniques that do not make any assumption of linearity by comparison to principal component analyses nor spatial see-saw property as implied in the traditional NAO index computed from a fixed location (normalized pressure difference between the Azores and Iceland). Spatial asymmetry is found in wind/temperature patterns between the two NAO regimes in agreement with the longitudinal shift of the anomalous centers of action and associated storm track that is intrinsically linked to the two NAO phases. Such an asymmetry has an important impact on the ocean, especially along the European coast, where it is the most pronounced (Cassou et al 2011). The third regime (supplementary figure S1(c)) is named Atlantic ridge (AR) and is characterized by a northward swelling of the Azores high and a trough over Europe leading to northerly wind along the Europe oceanic flank. The fourth regime (supplementary figure S1(d)) is often referred to as Scandinavian blocking and is characterized by a strong anomalous pressure anomaly over Northern Europe while a mild deeper trough extends southeastward from the Labrador Sea to the Iberian Peninsula. Links between flow regimes and anomalous climate conditions over the continent of Europe have been extensively documented in the literature from daily to decadal timescales (Yiou et al 2007), as well as over the ocean (Minvielle et al 2010, Barrier et al 2013).
Data collection and treatment
Many shellfish ecosystems are located close to estuaries and are affected by river runoff, which partly controls the variability of organic and inorganic matter concentration, nutrient input and salinity in coastal waters. For the present work, six coastal sites located in areas under estuarine influence are studied (figure 1(a)). The daily discharge rate of 12 rivers located close to the six selected locations are extracted from the Data Center for Operational Coastal Oceanography database (Ifremer, http://previmer.org/produits) (supplementary table S1). The flows of rivers located in the same embayment are added to get the total river flows from March 1993 to December 2014.

Figure 1. Time series for December–March (DJFM) winter NAO+ occurrences and annual oyster mortality rate. (a) Location of the six monitored stations along the French Atlantic coast: Arcachon (A), Breton Sounds (Br), Bourgneuf (B), Vilaine (Vi), Mont Saint-Michel (M) and Veys (V). (b) Centroid of the NAO+ weather regime obtained from daily anomalous sea-level pressure from NCEP/NCAR reanalysis (see Methods). The box shows the region of interest. (c) interannual oyster mortality rate averaged over the six stations (in %, black dots) and cumulated number of NAO+ days per winter (red triangles). Grey shading represents the inter-site standard deviation. The correlation coefficient between the two time series is equal to 0.77 (P < 0.01 based on r-test).
Download figure:
Standard image High-resolution imageIn situ seawater temperature and salinity data from March 1993 to December 2014 are extracted from the French national monitoring network for phytoplankton and phycotoxins (REPHY, http://envlit.ifremer.fr/surveillance/phytoplancton_phycotoxines/). Measurements at a depth of 1m are performed on a monthly basis at a fixed point in each of the six study sites and at similar tide level and tidal amplitude for better consistency/homogeneity. Annual and seasonal: winter (JFM), spring (AMJ), summer (JAS), and fall (OND) averages are computed.
Daily chlorophyll-a concentration time series from 1998 to 2014 are obtained from ocean colour remote-sensing using merged SeaWiFS, MODIS and MERIS data processed using a regional algorithm specifically designed for the coastal waters of the Bay of Biscay (Gohin et al 2002, Saulquin et al 2011). The daily sea surface temperature (SST) is obtained from remote-sensing products from the advanced very high resolution radiometer (AVHRR) over 1986–2008 and from the Group for High Resolution Sea Surface Temperature (GHRSST) initiative over 2009–2014 (Martin et al 2012).
The oyster mortality rate has been measured within the French national monitoring program for oyster growth and survival, REMORA (1998–2008) and RESCO (2009–2014) following a standard protocol (http://wwz.ifremer.fr/observatoire_conchylicole) (Fleury et al 2018). A set of 300 18-month-old oysters was deployed every year from March to March (year+1) in the six study sites (figure 1(a)). The mortality rate was measured every three months from 1993 to 2008, and on the monthly or bi-weekly scale from 2009 to 2014, depending on the season. The mortality rate was then cumulated by year or by season (winter—JFM, spring—AMJ, summer—JAS and fall—OND). The standardized monitoring stopped in December 2014.
All the data were normalized, by subtracting from each value the overall mean and dividing the result by the standard deviation, giving the so-called standard score z-values. All statistics were performed using R software (R Development Core Team 2012).
Results and discussion
The correlation between the annual mortality rate of adult oysters and the previous winter cumulated daily occurrence of each weather regime is first computed over the period 1993–2014 in six shellfish ecosystems along the French coast. The highest correlation is found for the NAO+, whose wintertime occurrence explains ∼60% of the interannual oyster mortality variability (figures 1(b), (c)). Cross-correlations are significantly positive between most of the sites (supplementary table S2), and for each monitored location, the correlation with NAO+ is always significant and systematically outperforms those obtained with the traditional NAO index (supplementary table S3). The weak, yet consistent, anticorrelation with NAO- occurrence suggests that the spatial asymmetry and nonlinear properties of the two NAO phases and associated fingerprint in local climatic variables (SST anomaly, freshwater budget, solar radiation, turbulence/ocean vertical mixing associated with preferred storm path, ocean dynamics, etc), as captured through regime decomposition (Barrier et al 2013), are important for impact assessments on oyster mortality along the French Atlantic coast.
Complex interactions between pathogens (virus and bacteria), environment (water temperature, freshwater input, salinity and eutrophication) and oyster physiological status (reserves metabolism, reproductive effort, growth rate) have been identified in the literature as key parameters in oyster mortality etiology (Samain and McCombie 2008, Bushek et al 2012, Petton et al 2013, Pernet et al 2016). More specifically, for temperate ecosystems, higher overwintering temperatures are known to favour later pathogen development and transmission as they preclude the so-called 'winter cold-water barrier' to pathogen growth to act (Harvell et al 2002, Vezzulli et al 2012). Increased freshwater outflow from rivers and subsequent salinity variations have also been identified as a driver of shellfish diseases (Bushek et al 2012), and oyster mortality can be mediated as well by excessive increase in phytoplankton concentration, either directly due to anoxia risks or indirectly due to metabolic disorders associated with reproductive effort and stress, through trophic and bioenergetics relationships (Samain and McCombie 2008). Among pathogens, Vibrio strains (e.g. V. aestuarianus, V. splendidus) have been reported to be responsible for adult oyster mortality outbreaks (Saulnier et al 2010). Vibrio are ubiquitous marine bacteria of estuarine and coastal waters with moderate salinity, strongly affected by temperature variations: cold temperatures induce a dormant state, whereas warmer temperatures are expected to increase Vibrio abundance due to an enhanced growth rate and plankton-attachment process (Deter et al 2010, Vezzulli et al 2015). The sediment is also an important reservoir where these bacteria can persist during unfavorable conditions (Azandégbé et al 2010) and can remobilized through resuspension during storms. Here, we provide evidence that frequent NAO+ circulations in winter combine and reinforce all the above-mentioned environmental risks, favoring oyster mortality.
During NAO+, both air temperature and rainfall anomalies are significantly positive north of 40° of latitude over Europe and this locally translates, at the six monitoring stations, into higher sea surface temperature (SST), higher river flow and lower salinity, and higher chlorophyll concentration due to the intrusion of nutrient-rich riverine waters (figures 2(a)–(d) and supplementary table S4). Note that consistency in interannual fluctuations between all the local factors and the seasonally-integrated atmospheric circulation assessed here through regimes is remarkable considering sparse sampling issues in local observations (see Methods), especially for fields such as salinity, river discharge and chlorophyll concentration that are potentially affected by strong daily-to-weekly variability. A temporal delay exists between the wintertime atmospheric forcing and the biological response (Adrian et al 2012). Oyster mortality is maximal in subsequent spring and summer seasons (supplementary table S4) and can be related to the long-lasting NAO+ imprint on river flow and coastal water salinity (buffer and integrator effects of local watersheds and snowpack-melting delay effect for the Loire and Garonne rivers) as well as to its preconditioning role for summertime phytoplankton development. This is not valid for SST anomalies, which are not persistent beyond winter months (van Aken 2008). The loss of seasonal correlation further reinforces the importance of the above-mentioned 'winter cold-water barrier' mechanism to interpret the following year mortality of oysters. In addition, metabolic activity rates during winter are determining factors for oyster future life conditions: stronger activity associated with milder wintertime temperature implies greater vulnerability in the following spring and summer seasons, primarily because of early maturation that is known to decrease oyster defense capacities related to hemocyte parameters (Delaporte et al 2006). The full seasonal life-history experienced by an oyster over an entire year in terms of metabolism activity, thus appear to be crucial in interpreting and understanding the observed annual mortality. More in situ temporal datasets, especially pathogen baseline data, are however needed to better disentangle the multi-etiology nature of marine disease (Harvell et al 2002, Vezzulli et al 2010, 2012). Nevertheless, our results, by integrating complex spatiotemporal interactions, provide a pathway forward to increase the overall functional and quantitative understanding of the response of coastal ecosystems to environmental changes. We anticipate that the relationship between annual oyster mortality and wintertime NAO+, which has been established here over five degrees of latitude along the French Atlantic coast, might be even stronger all over the current distribution area of the Pacific oyster, from the English Channel to Norway. Indeed, the correlation between the NAO+ regime and bioclimatic factors increases with latitude, as shown for instance for winter SST using the high resolution satellite product (figure 3).
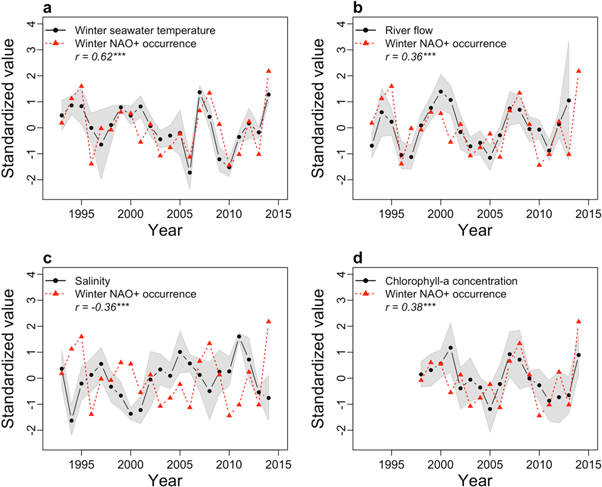
Figure 2. Correlation between DJFM NAO+ regimes occurrences and JFM local hydro-biologic variables involved in oyster mortality. (a) Winter averaged sea surface temperature (SST), yearly averaged (b), river flows (c), salinity and (d) chlorophyll—a concentration (black dots) and cumulated number of days of NAO+ regimes per winter (red triangles). Data have been standardized. A one-month lag has been introduced between regime and bioclimatic variables to account for the typical three-week lag between atmospheric forcing and ocean response at midlatitudes (Deser and Timlin 1997). The correlation coefficient r and the significance of the linear regression (*** for P < 0.01 based on r-test) are given on the plots. Grey shading represents the inter-site standard deviation.
Download figure:
Standard image High-resolution image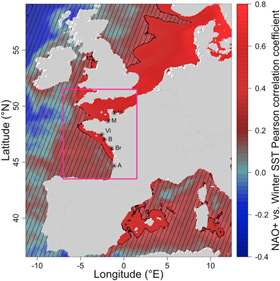
Figure 3. Point-wise correlation between DJFM winter NAO+ regime occurrence and JFM sea surface temperature along the European coast from the combined AVHRR and GHRSST satellite products. Correlation is computed over the period 1986–2015. Hatched area represents nonsignificant values at the 95% level of confidence, based on r-test. The geographical position of the six monitored stations are shown on the map. The box (in magenta) shows the domain for satellite data and climate models extraction for the calculation of the winter SST anomaly and mortality risk factor.
Download figure:
Standard image High-resolution imageBased on the above documented relationship, we now conduct a conceptual study to retrospectively reconstruct the annual oyster mortality rate back to 1900 using historical NAO+ occurrence as a predictor in a linear regression model. To build the predictive linear regression model we use the relationship between the mortality rate and the wintertime NAO+ occurrences over the 1993–2014 observational period: oyster yearly mortality rate (%), with the cumulated wintertime NAO+ occurrence (day). To increase sampling, we treat the six locations separately leading to a sample size of 132 pairs (n = 22 years x six locations) of mortality-NAO+ occurrence from which 1000 regression coefficients are computed through bootstrapping. Those are obtained by random selection, with replacement, of n pairs of observations from the original sample. The 1000 predictive models are then used to hindcast the mortality from observed winter NAO+ occurrences used as predictors over the period 1900–2014. Note that over the calibration period of the regression models (i.e. 1993–2014), the years-to-be-predicted are excluded from the bootstrap procedure enabling cross-validation; the model captures 61% of interannual variability combining all sites, during this training period. The full temporal probability density function (pdf) of the reconstructed oyster annual mortality rates are separated into two epochs based on the value of the 20-year running average standard deviation of the NAO+ occurrences (figure 4).

Figure 4. Decadal modulation of winter NAO+ from 1900 to 2014 and consequences on oyster mortality. (a) Observed cumulated number of winter NAO+ daily occurrences from combined NOAA-20CR/NCEP-NCAR reanalyses (Kalnay et al 1996) over 1900–2014 (one dot per winter) and (b) 20-year running mean (in black) and standard deviation (STD, in red) used for identification of decadal period with frequent and strong interannual variability of NAO+ occurrence (FS, blue shading), or with rare and weak interannual variability (RW, green shading). (c) Probability density function of the hindcast simulated oyster annual mortality rate (see text for details) for the FS and RW NAO+ decadal phases, taken separately. Terciles are defined from the full sample leading to three mortality classes: low (L), medium (M), high (H). Extreme (very low—VL and very high—VH) mortality rates correspond to the lower and upper 10% percentile. Cumulated probability in % is provided for each class conditionally to the decadal phase of NAO+ occurrence. Results are not significantly dependent on the period used for computation. Over the period 1960–2014 corresponding to the period where the Pacific oyster is present along the European coasts, values of the cumulated probability for the VH mortality class are 19% and 0.8% for FS and RW periods, respectively, instead of 15.2% and 0.6% over the period 1900–2014.
Download figure:
Standard image High-resolution imageOver the last century, considerable decadal variability exists in the North Atlantic atmospheric circulation. The period from the 1900s to early 1940s is characterized by frequent NAO+ regimes, which contrasts with decades of rare NAO+ occurrences from the 1950s to late 1970s (figure 4(a)). From the 1980s, NAO+ dominates again and explains a significant fraction of the temperature and precipitation trends observed in Europe (Hurrell 1995). Frequent NAO+ decades are also characterized by stronger variance (figure 4(b)) leading to a complete change of the NAO+ probability density function (pdf). As expected, decades with frequent NAO+ led to a higher mortality rate compared to decades of rare NAO+ (figure 4(c)). But more importantly, beyond mean changes, the upper tail of the distribution of the reconstructed mortality appears to be the most altered due to an increase of interannual variability: the probability of extreme mortality events (beyond the 90th percentile of the pdf computed over the entire 115 years of hindcasts) exceed 15% during the decades of frequent and high NAO+, whereas it is only 0.5% during the decades of rare and weak NAO+.
From a historical and societal perspective, it is worthwhile noting that the natural and aquaculture expansion of the Pacific oyster along the European coasts started in the late 1960s, which incidentally happened to correspond to an epoch of low mortality risk for this species (figure 4(b)). This was followed by a period of much higher risk level from the 1980s onwards during which mass mortality events recurrently occurred and had important economic consequences on the aquaculture industry (estimated loss of 10 million Euros in yearly turnover for each 1% of over-mortality in France, considering current price: ∼8 € kg−1, and production: 125.000 tons/year). The seasonal predictability of oyster mortality using preceding winter NAO+ cumulated occurrence opens up the opportunity for anticipation of potentially valuable management and support strategies that could be useful to mitigate losses at several months leadtime.
Our findings suggest that the late enhanced vulnerability of the Pacific oyster could be mostly interpreted as the byproduct of regional-scale internal atmospheric variability (Xie et al 2015) through natural decadal variations of the NAO and associated impacts on the ocean (see in Cassou et al 2011 their figure 6 showing reconstructed surface ocean fields based on pure atmospheric dynamics). Superimposed anthropogenic GHG forcings leading to SST warming may have aggravated the vulnerability since the mid-1990s in conjunction with the sign-flip of the so-called Atlantic multidecadal variability (Yeager and Robson 2017) in positive (i.e. warm) phase, whereas anthropogenic aerosols effects leading to basin-scale cooling (Booth et al 2012, Terray 2012) may have lowered the vulnerability over the 1960–1970s period. All this together demonstrates the importance of acquiring and analyzing long-term homogeneous time series (Martinez et al 2009), as well as the necessity of taking into account for all the outcomes of interannual-to-decadal climate variability, when dealing with ecosystem management, species conservation strategies, and risk assessment.
Simple knowledge and practices from the past are, however, not sufficient to anticipate the future risk of oyster mortality because the prevalence of the anthropogenic factors will inevitably be rising. Several impacts on the marine environment, including oysters, have already been documented based on current evidences of ecological responses to climate trends, including shift, feedback processes, match-mismatch, and species' tolerance evolution (Mysterud et al 2001, Harvell et al 2002, Walther 2010). For instance, concurrently to the development of aquaculture along the European coasts, the natural poleward expansion of the Pacific oyster related to seawater warming has been demonstrated through the expansion of its reproductive niche (Thomas et al 2016). RCP8.5 and RCP2.6 climate projections are now used to provide a risk evaluation over the 21st century in light of the above-demonstrated influence of the NAO+ regime through associated systemic and integrative bioclimatic stressors. Whatever the scenario, climate projections do not show any predictable evolution for the winter NAO in the 21st century (e.g. Cattiaux and Cassou 2013), which is still expected to be largely dominated by internal variability. Direct use of the historical NAO+/mortality relationship is therefore not possible for future risk assessment. We overcome the lack of predictability of the atmospheric pure dynamical component by considering thermodynamical-related fields, here the winter SST anomaly. The choice of SST anomaly is based on the literature, which shows the prominent influence of the latter factor on mortality (e.g. Alfaro et al 2018, for a review) and which is accordingly expected to be one of the primary mediators through which NAO+ acted on mortality over the historical period (supplementary table S4). In other words, observed winters with very high SST anomalies, which are currently (i) associated with NAO+ strong occurrence owing to internal variability (supplementary tables S4 and S5), and (ii) generally precede very high mortality events (supplementary figure S2), can be treated as 'analogs' of future winters and a source of predictability to assess the evolution of the very high mortality risk in the coming decades as the climate is warming. The choice of SST anomaly is also driven by practicalities because SST is one of the least biased fields in climate modeling in oceanic regions where variability is not dominated by large-scale ocean dynamics (western boundary currents and their extension) but by air–sea interaction through fluxes (eastern basins at midlatitudes) like in the Northeastern Atlantic basin, our region of interest (see IPCC Assessment report 5, Flato et al 2013).
Simulated winter SST anomalies are computed with respect to the 1986–2015 period for each of the individual climate historical simulations available in the CMIP5 archive, which have been concatenated to their respective RCP2.6 and RCP8.5 projections, from 2006 onwards, prior to computation, and then averaged over a broad 5°W/0.5°E-45°N/50.5°N domain (figure 4). A set of 121 members from 36 climate models has been extracted (supplementary table S6). The same technique is applied from remote-sensing data using the combined AVHRR and GHRSST archives. Combining coarse resolution models (i.e. IPCC-type), observational datasets of diverse refinement and temporality (here satellite) and station-based measurements is quite a challenging issue for downscaling and related impact studies. The regional domain chosen here for SST anomaly computation should be interpreted as a compromise between all the constraints. It corresponds to a few grid points in models/observations that are representative, yet partly, of the interannual variability assessed from coastal local stations. All the 36 models used here (supplementary table S6) project an increase in seawater temperature along the French Atlantic coast (figure 5(a)). On average, winter SST levels off in RCP2.6 around 2040 at about +0.5 °C with respect to the 1986–2015 baseline, but climbs up to about +2 °C in RCP8.5 by 2100. Note that both trend and interannual standard deviation of observed winter SST anomalies are within the models' range, increasing our confidence in future risk assessment for mortality.

Figure 5. Observed and simulated evolution of winter SST anomaly off the French Atlantic coast and associated risk factor, leading to oyster extreme mortality. (a) Historical+ projected winter (JFM) SST anomalies from CMIP5 climate models following RCP8.5 (red) and RCP2.6 (blue) scenarios averaged over a broad Biscay Bay + English Channel domain (see text for details). Counterpart from satellite data is given in black and the reference period for anomalies computation is 1986–2015 corresponding to the temporal availability of the observations. Thin curves stand for each model member and thick curves correspond to ensemble means. Colored surface represents one intermembers standard deviation. White dots correspond to in situ records averaged over the six stations. Correlation between box-averaged satellite SST and local-averaged measurements is equal to 0.60. (b) Risk factor evolution for satellite historical data (black), RCP8.5 (red) and RCP2.6 (blue) scenarios (see text for details). Horizontal lines materialize the 10% and 50% levels corresponding to a probability of occurrence equal to 1/10 and 1/2 (ToE: time of emergence), respectively.
Download figure:
Standard image High-resolution image
Inspired by a recent study on coral bleaching (Frieler et al 2013), we define a 'risk factor'ρ based on frequency of exceedance of the 90th percentile of the winter SST distribution computed over the historical 1986–2015 period in order to indirectly assess the probability for very high mortality in the future. The rationale for this approach is based on the observational evidence that years affected by the strongest mortality rates are mostly found in the upper tail of the winter SST anomaly distribution, which is governed to a large extent by NAO+ occurrence as documented earlier (supplementary figure S2). The mean mortality rate computed from years characterized by SST anomaly greater than the 90th threshold is equal to ∼0.20. This corresponds to the 95th percentile of the mortality distribution assessed from reconstruction through simple linear modeling over the period 1900–2014 (figure 4) and to the 80th percentile over the direct observation calibration period. The risk factor ρ is derived for running chunks of ten years of SST anomalies following the percentile rank formula:
with  the risk factor of the ten year period i, considering the reference temperature threshold
 the number of years over the ten year period i with SST lower than
 the number of years over the ten year period i with SST equal to
  and
and  the total number of values, here ten by construction. We replicate the same procedure for each model member taken independently, namely anomaly computation and 90th percentile determination. This allows us to account indirectly for model biases in the simulated pdf (mean and variance) of the SST. Values for ρ should be interpreted as the following: if ρ = 10%, it means that there is a probability of one year out of ten of measuring SST anomalies greater than its 90th percentile, or in other words, belonging to the last SST decile characterized by a very high mean rate of mortality (about 20%) as estimated from direct local measurement (supplementary figure S2); the latter value is considered as the reference or climatological risk over the reference period 1986–2015.
The risk factor ρ is given in figure 5(b) for ten-year-long running chunks over the period 1986–2015 for the observations and the individual historical model simulations followed by values computed from RCP2.6 and RCP8.5 individual model projections. Results indicate a dramatic increase in the risk in the 2020s whatever the scenario. The analysis of the models' ensemble means indicates that the time of emergence (ToE, defined as the year when current extreme winter SSTs become the norm, i.e. ρ = 50% (Hawkins and Sutton 2012)) will be reached around 2035. The average risk factor saturates around 60% in RCP2.6 but reaches 100% in 2070 in RCP8.5. Ensemble means mask considerable uncertainties in the ToE estimate because of natural decadal variability, which either amplifies or delays the effects of anthropogenic trends. Consequently, the ToE could be reached as soon as the mid 2020s due to the combination of background warming caused by accumulating CO2 and unfavorable conditions associated with recurrent, yet natural and unpredictable, NAO+ type of winters. This would have considerable impacts, reducing the window of opportunity for possible adaptation of the oyster aquaculture industry, independent of future emission scenarios. Following the exact same approach, we tried to evaluate the mortality risk from the modeled sea surface salinity changes (SSS, figure S3) but local observed salinities are dominated by coastal processes (river discharge, estuary and local watershed effects, etc), which are not meant to be accurately represented in IPCC-class models, as opposed to temperature anomalies intrinsically embedded in larger-scale variability (figure 5). As a consequence, no firm and robust conclusions can be drawn from SSS. Other factors, such as chlorophyll concentration, are not available in standard IPCC ensembles.
Predicting ecosystem evolutions is generally based on long-term anthropogenically-forced warming trends. Our findings, in line with recent studies (Wernberg et al 2013), provide evidence for the crucial need to consider interannual-to-decadal natural climate variability in conjunction with gradual temperature rise to both (i) understand historical oyster mortality outbreaks, and (ii) to accurately anticipate the possible temporal evolution of the mortality risk for this species. We confirm that even limiting the global temperature increase to +2 °C above the pre-industrial period (as targeted in RCP2.6) is very likely to produce negative and disruptive impacts on coastal ecosystems (Magnan et al 2016) and should necessarily impose a rapid implementation of adaptation strategies at multiple levels (environmental, economic, social, etc). It is, however, impossible to accurately evaluate whether our risk evaluation based on the sole use of winter temperature chosen here as the most relevant, yet incomplete, fingerprint leading to mortality, corresponds to either a conservative or a pessimistic future outcome. Indeed, we had not accounted for possible interactions with the other mortality risk factors (e.g. disease, predation, food) (Frieler et al 2013), which may lead to possible feedbacks. Further in situ and laboratory analyses are thus urgently needed following a process-based approach to account for the multiple and systemic drivers (Henson et al 2017) (coastal runoff, acidification, hypoxia, energetics, pathogens, etc) in oyster mortality etiology, and a better understanding of the adaptive capacities of Pacific oysters in a changing ocean is a priority. However, one can expect that the pace of the adaptation at a given site and from a practical perspective is unlikely to be fast enough judging by the very pronounced rate of increase of the projected mortality risk over the next 20 years as assessed here from a systemic-oriented framework combining the best available and most reliable information from historical observations and climate model simulations.
Acknowledgments
This work was performed in the frame of the GIGASSAT project (grants ANR-12-AGRO-0001-01 and ANR-12-AGRO-0001-05). CC is supported by CNRS and by the MORDICUS grant under contract ANR-13-SENV-0002-01. The authors are grateful to the Ifremer staff of the RESCO and REPHY networks, through which all the field data were gathered. We acknowledge F Gohin and P Bryère for their help in supplying the satellite data and S Qasmi for his help extracting the model outputs from the CMIP5 archive. We would like to thank the two anonymous reviewers for their thorough review and helpful comments.